Visit Activity Dashboard
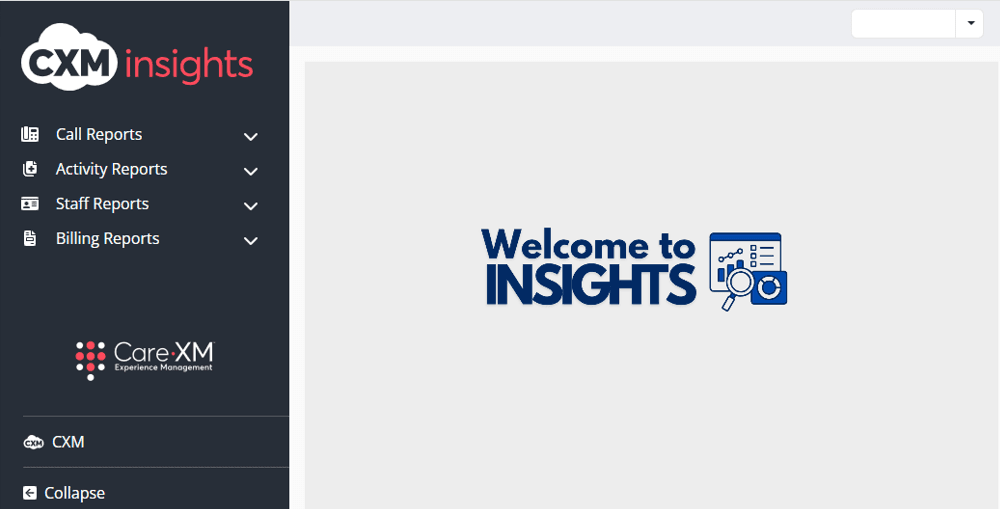
To access Insights, go to https://insights.carexm.com
You will use the same login information that you use to access CXM to log into Insights. This means that if you change your CXM password, it will update in Insights as well.
Your CXM user must have the Analytics toggle turned ON in order to log into Insights.
Once logged in, you will be on the landing page and can choose from the different reports by hovering over the category in the left side bar:
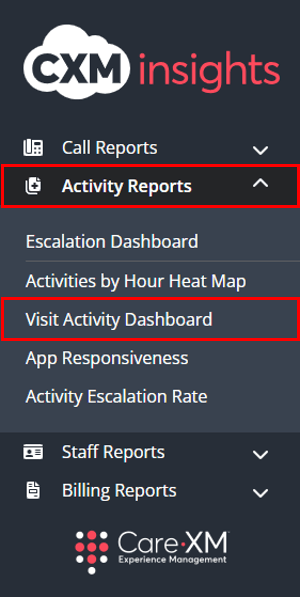
Choose “Activity Reports”, then “Visit Activity Dashboard”.
The Visit Activity Dashboard provides visibility into the percentage of activities with a status indicating a visit. These statuses are identified by the word "visit" being present in the status. Additional information provided when on-hovered.
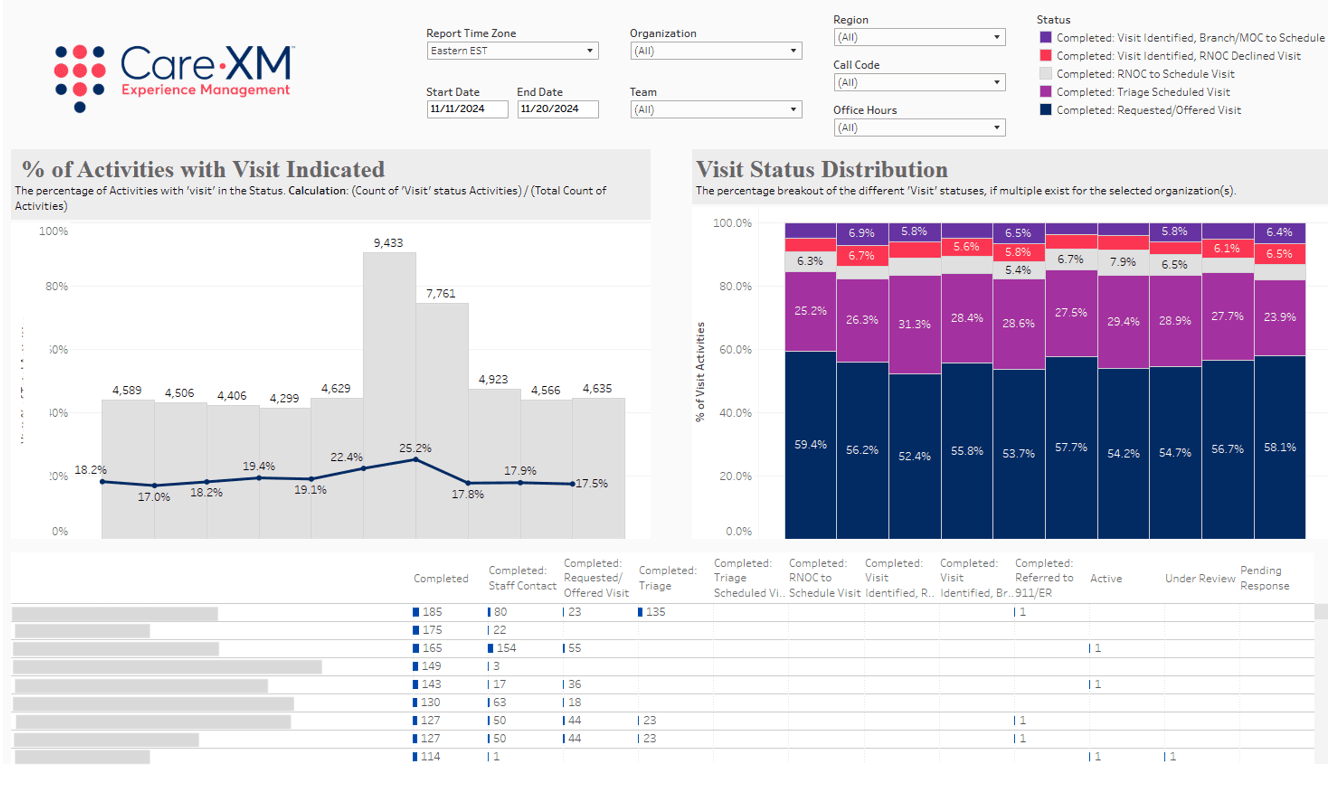
This report can be filtered by Report Time Zone, Organization, Region, Date Range, Team, Call Code, US State, Agent Group, and Office Hours.
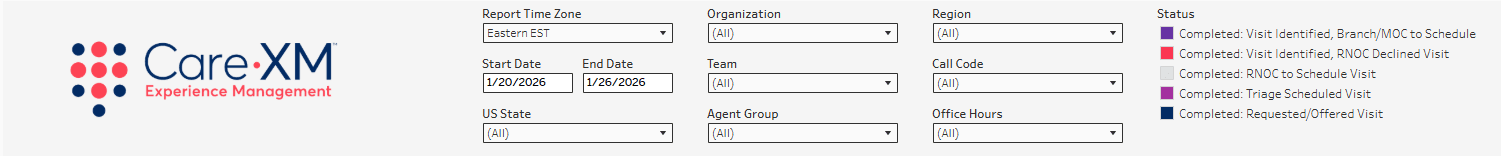
- Report Time Zone - This filter will set the time zone of all activities and calls shown on the dashboard to the selected time zone. This filter defaults to EST.
- Organization - Choose organization(s) to view in the dashboard. Defaults to all, user will only see organizations they have access to.
- Region - This filter allows users to filter large organizations by the Regions set on the Organization page, and quickly filters to a group of Organizations in a specific geographical area.
- Start Date / End Date - These filters allow the user to set the date range for the data shown within the dashboard. The date range is set to the last 10 days by default.
- Team - This filter allows the user to see only what was created by a specific team. For example, if filtered down to CareTriage, the report would only show data for calls handled by CareTriage.
- CareAssist - Calls taken by CareXM Non-Clinical team (Patient Care Advocates).
- CareTriage - Calls taken by CareXM Clinical team (Registered Nurses).
- CXM App - Calls taken in the Legacy CXM App (Total Triage).
- CXM - Calls taken by Enterprise client users.
- Note: User will only see Teams used by organizations they have access to. Each team has their own color representing their data.
- Call Code - This filter allows the user to select the main concern/purpose of the call.
- Note: This filter does not adjust the counts for the Inbound Answered Calls or Outbound Calls tiles.
- US State: This filter allows users to filter the list of Organizations down to those located in the selected geographical state(s). By default, all Organization States will be selected.
- Agent Group - This filter allows users to filter call reports down to call volume handled by different groups of agents within the call center. (Enterprise clients only)
- Office Hours - This filter allows users to filter the data to show Calls or Activities that occurred only during Office Hours or After Hours.
Note: For report to filter correctly, click on the "Apply" button on the bottom of each filter's drop down. Only applies if the list exceeds 10 options.
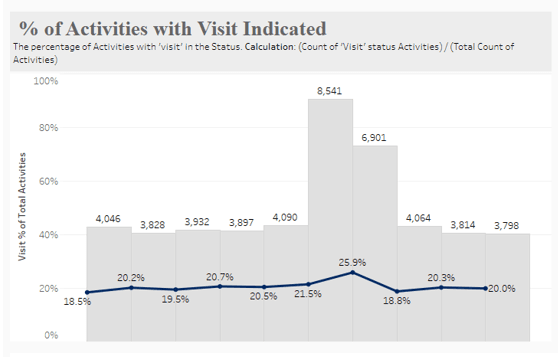
The Percentage (%) of Activities with Visit Indicated tile shows the total count of activities in the columns with the trending percentage of activities with a "visit" status.
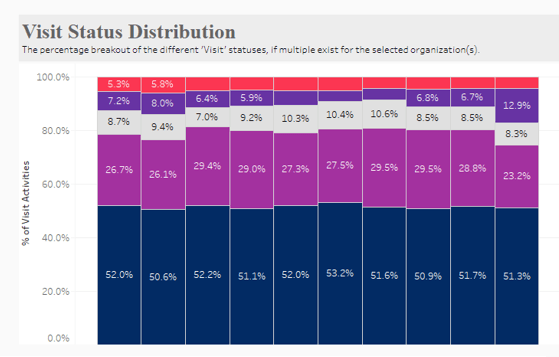
The Visit Status Distribution tile shows the breakout of the different "visit" status options - if the organization has multiple status options with the word "visit". Each status is represented by a different color (refer to key below).
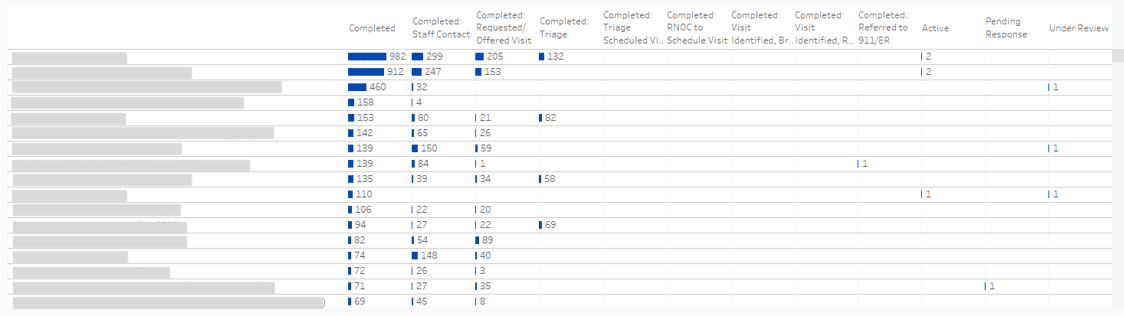
The data table at the bottom of the report shows the count of Activities in each Status by Organization. Users can click on each status option to choose to sort the list and see the organizations with the most Activities in that status.