Task Responsiveness
To access Insights, go to https://insights.carexm.com
You will use the same login information that you use to access CXM to log into Insights. This means that if you change your CXM password, it will update in Insights as well.
Your CXM user must have the Analytics toggle turned ON in order to log into Insights.
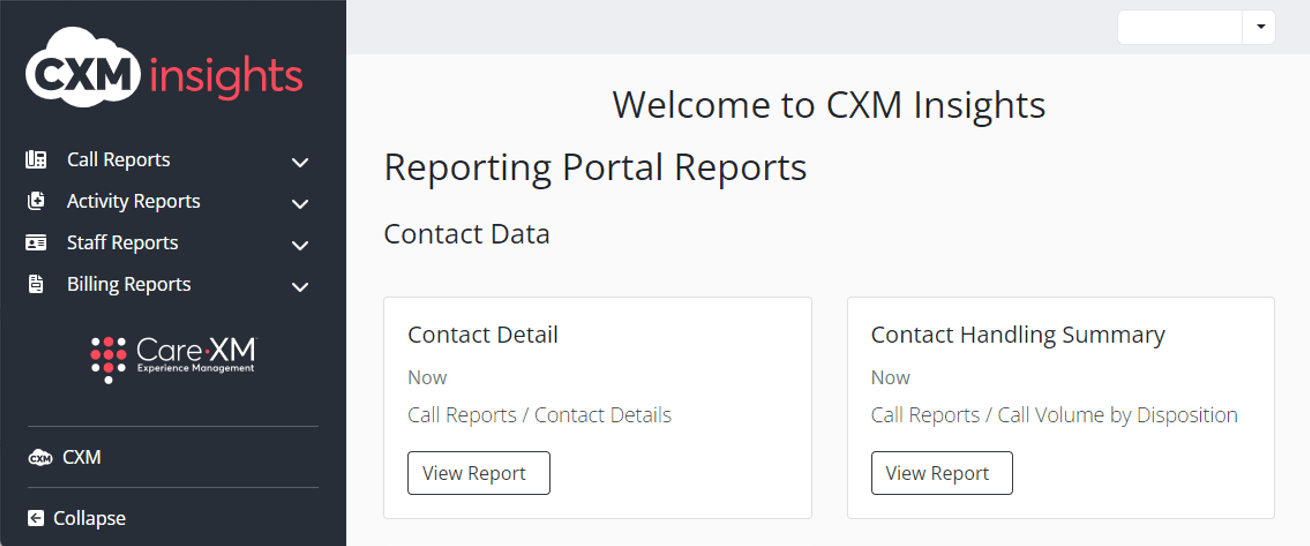
Once logged in, you will be on the landing page and can choose from the different reports by hovering over the category in the left side bar:
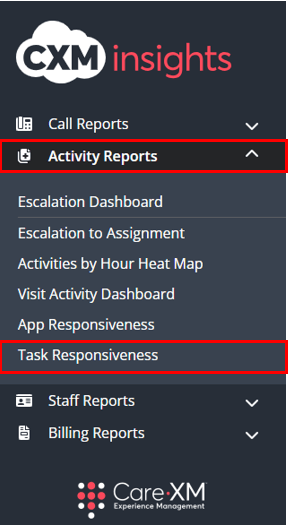
Choose Activity Reports then "Task Responsiveness":
The Task Response Dashboard allows managers to easily see how quickly their teams are responding to tasks.
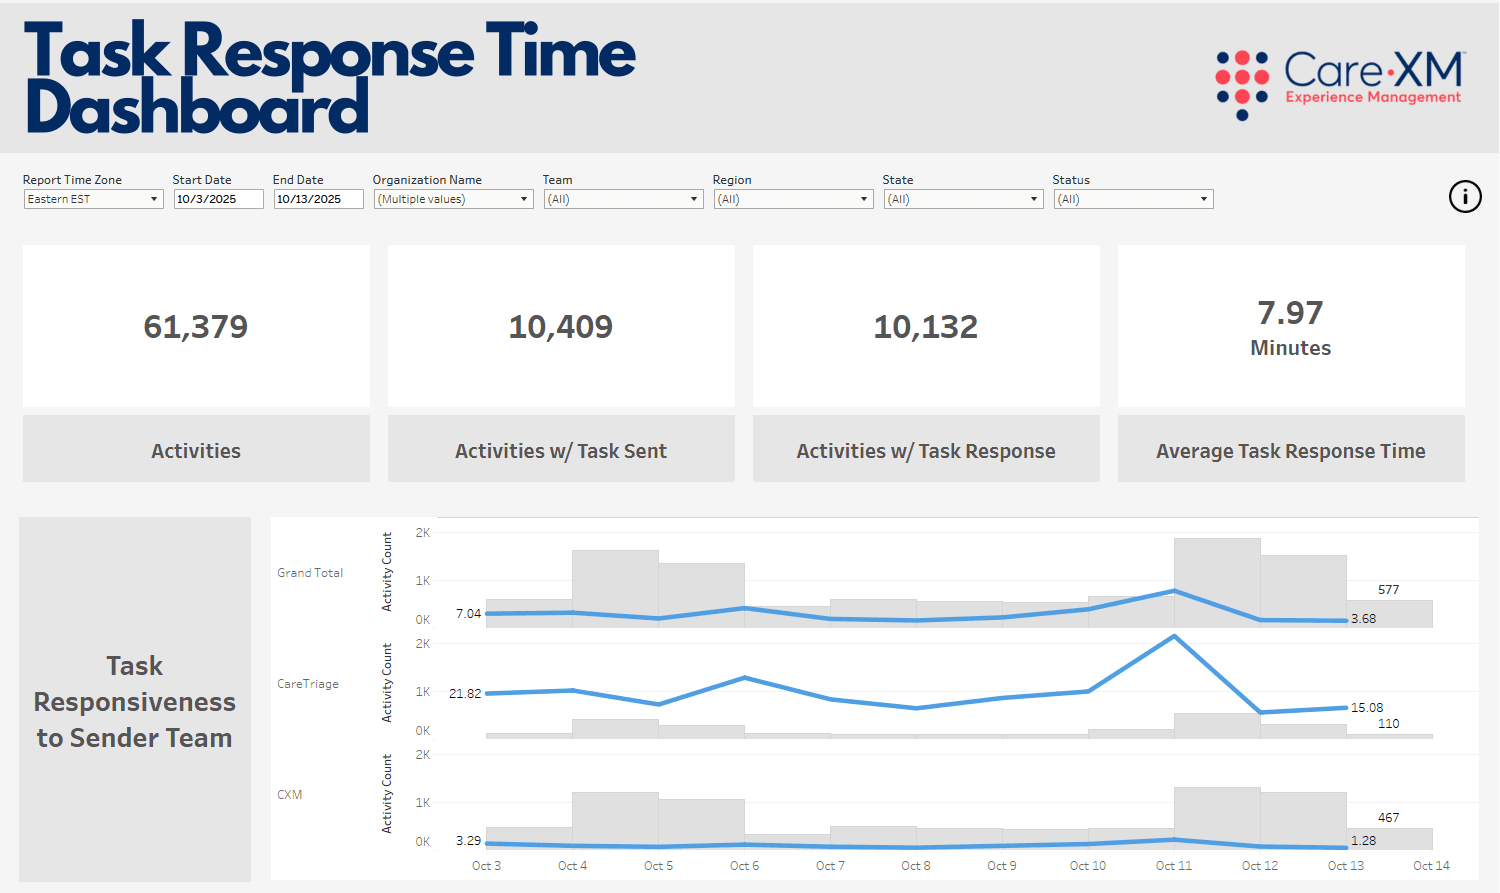
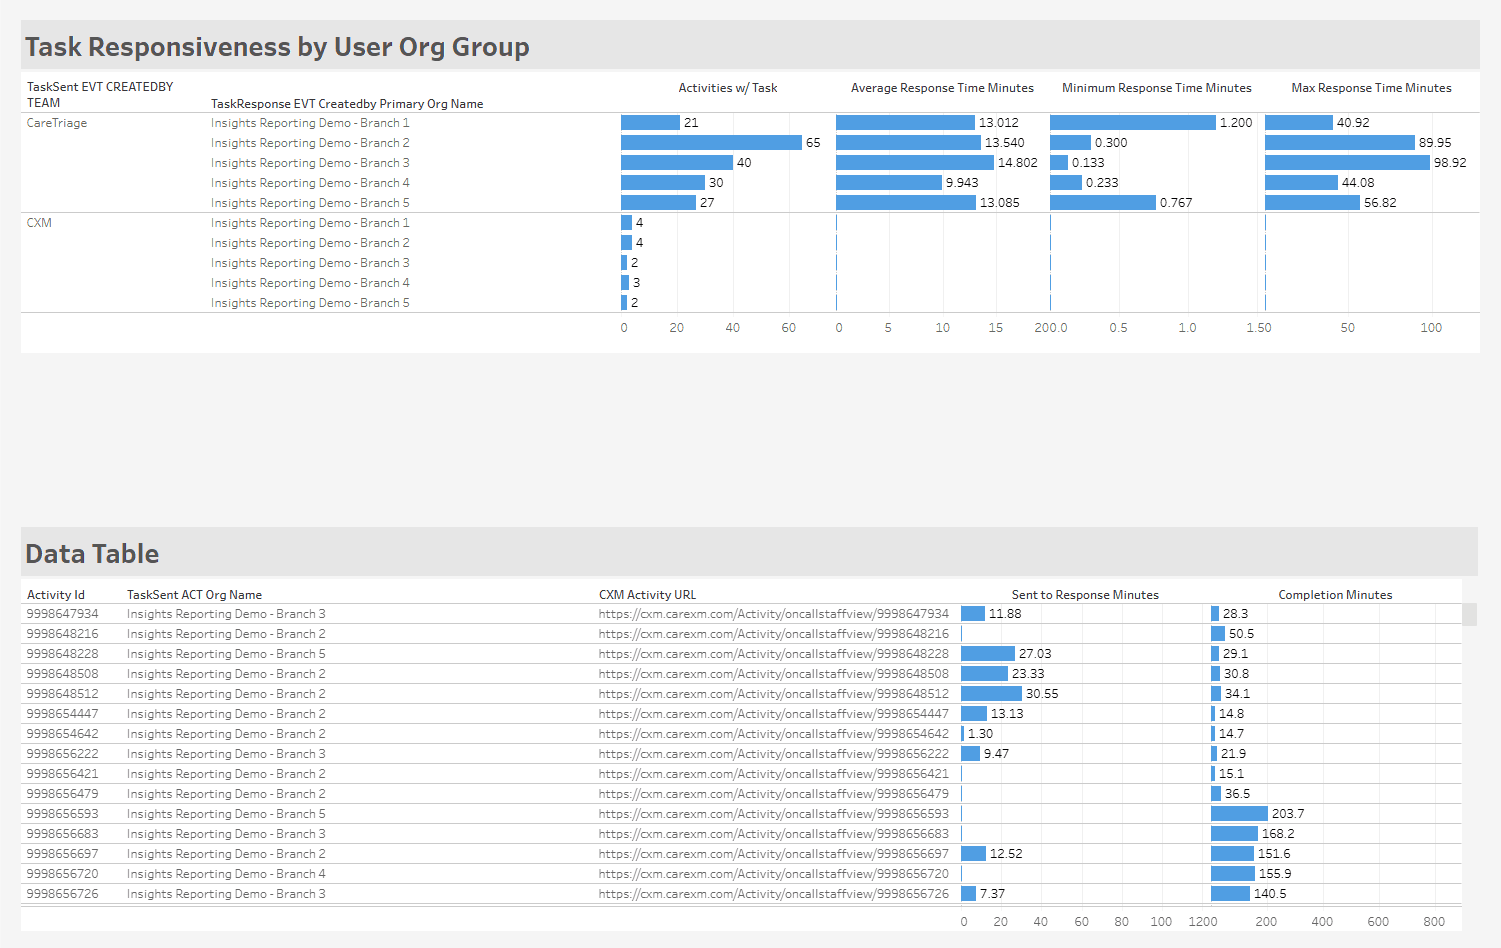
This report can be filtered by the Report Time Zone, Date Range, Organization Name, Team, Region, State, and Status.

- Report Time Zone - The report will process the data in Eastern time zone. To switch time zones, click on the drop down and choose the correct option.
- Start Date / End Date - These filters allow the user to set the date range for the data shown within the dashboard. The date range is set to the last 10 days by default.
- Organization Name - This filter allows the user to select the organization(s) for which they want to see data. Only Organization(s) that the user has access to AND that have data in the selected time frame will be shown in the filter options.
- Team - This filter allows the user to see only what was created by a specific team. For example, if filtered down to CareTriage, the report would only show data for calls handled by CareTriage.
- CareAssist - Calls taken by CareXM Non-Clinical team (Patient Care Advocates).
- CareTriage - Calls taken by CareXM Clinical team (Registered Nurses).
- CXM App - Calls taken in the Legacy CXM App (Total Triage).
- CXM - Calls taken by Enterprise client users.
- Region - This filter allows users to filter large organizations by the Regions set on the Organization page, and quickly filters to a group of Organizations in a specific geographical area.
- State - This filter allows users to filter the list of Organizations down to those located in the selected geographical state(s). By default, all Organization States will be selected.
- Status - This filter allows the user to select the final status of the call. For example, Active, Completed, Pending, etc..
On the top of the dashboard you will find four tiles:

- Activities - This tile will display the count of unique activities.
- Activities w/Task Sent - This tile will display the count of unique activities that had a task sent.
- Activities w/Task Response - This tile will display the count of unique activities that had a task sent and accepted.
- Average Task Response Time - This tile will display the average time from a task being sent and accepted. Does not include Tasks that were cancelled.
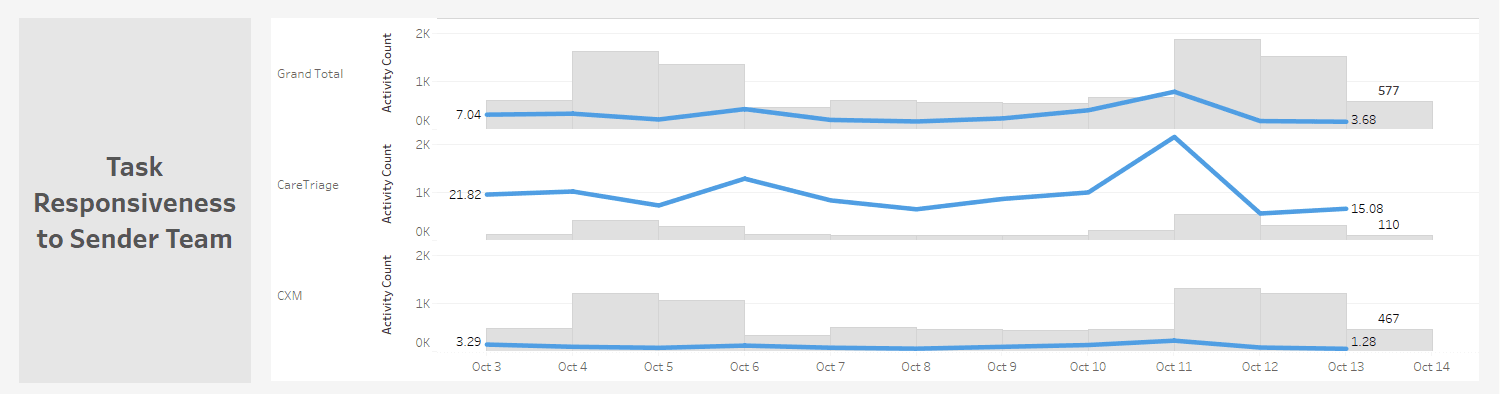
The Task Responsiveness to Sender Team has bar graphs and a trend line for each team to show the average time from a task being sent and accepted based on the Team and/or Primary Organization of the user/staff member who sent the task.
The Task Responsiveness by User Org Group displays the average time from a task being sent and accepted based on the Primary Organization of the user/staff member who accepted the task.
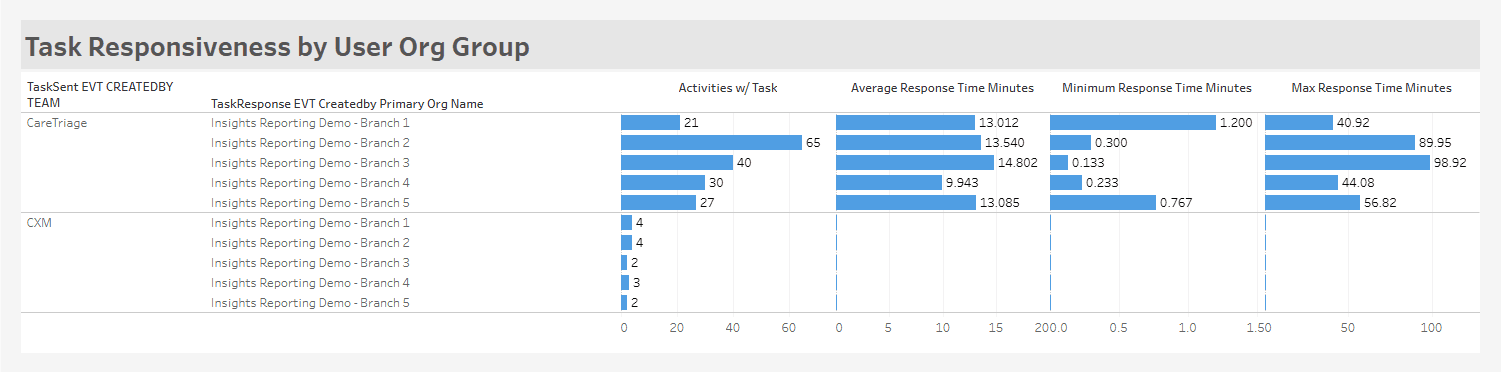
Clicking on items in the Task Responsiveness by Sender Team and Task Responsiveness by User Org Group tiles to see the other tiles update across the dashboard.
On the bottom of the dashboard you will find the Data Table with the Activity ID, Organization Name from which the Task was sent, CXM Activity URL, time it took the activity from being sent to responded (in minutes), and the completion minutes.
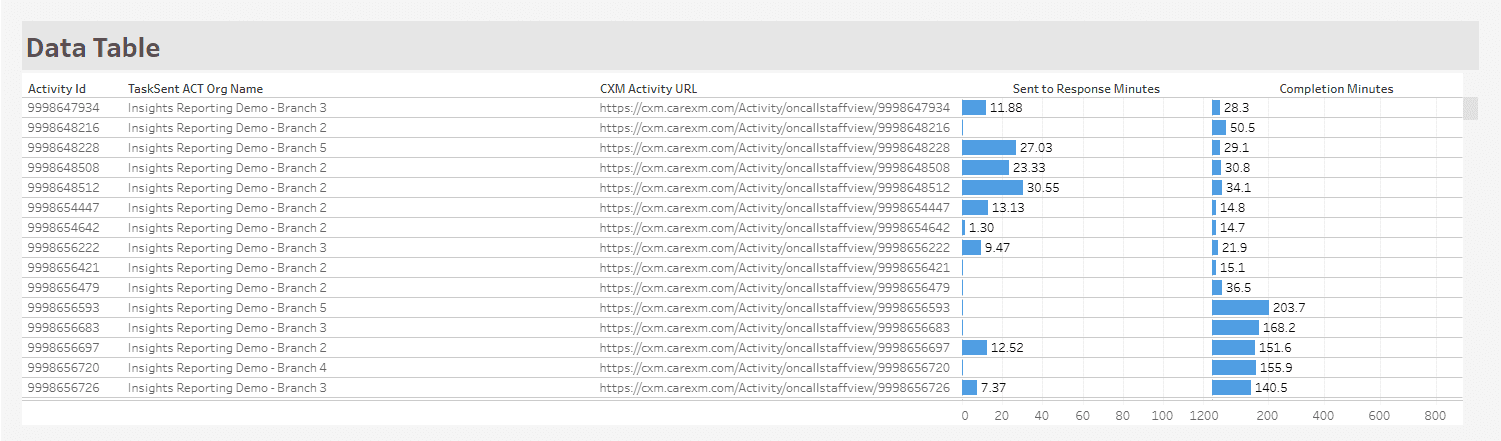
- Sent to Response Minutes - This bar represents the time (in minutes) from when the Task was sent to the client team until a user accepted the Task.
- Completion Minutes - This bar will represent the time in minutes from when a Task was sent until the activity was marked as completed.
To Download, select "Download" in the lower right hand corner of the report:
Choose your file format: