Productivity Dashboard
To access Insights, go to https://insights.carexm.com
You will use the same login information that you use to access CXM to log into Insights. This means that if you change your CXM password, it will update in Insights as well.
Your CXM user must have the Analytics toggle turned ON in order to log into Insights.
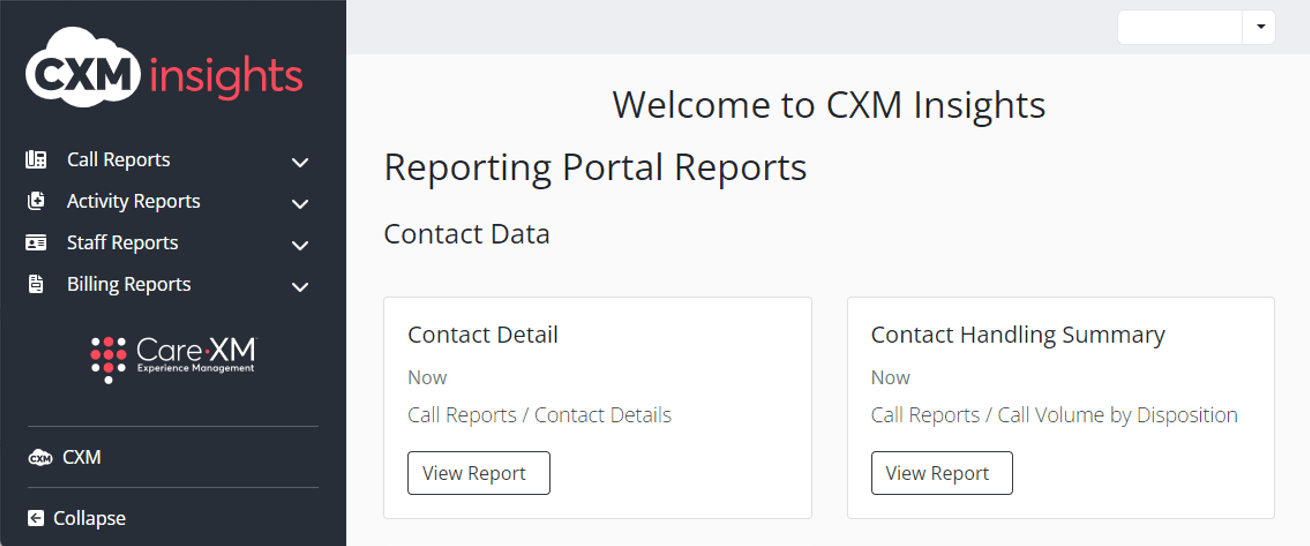
Once logged in, you will be on the landing page and can choose from the different reports by hovering over the category in the left side bar:
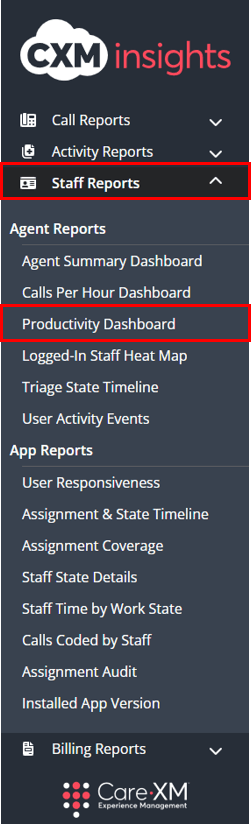
Choose Staff Reports then "Productivity Dashboard":
The Productivity Dashboard shows the productivity of agents within a call center, splitting their time under three broader terms - Productive, Working, and Not Working.
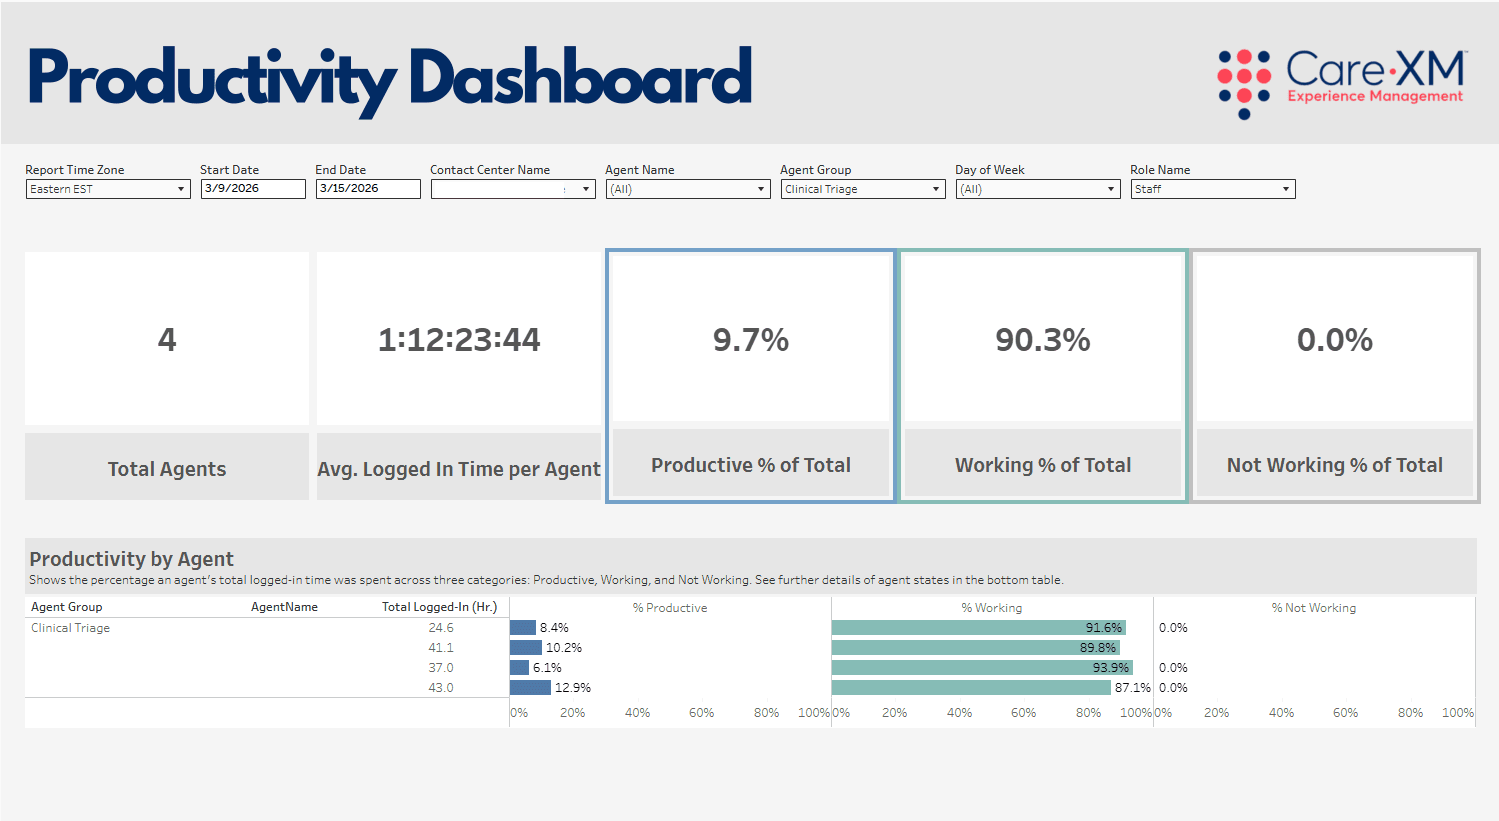
This report can be filtered by Report Time Zone, Date Range, Contact Center Name, Agent Name, Agent Group, Day of Week, and Role Name.
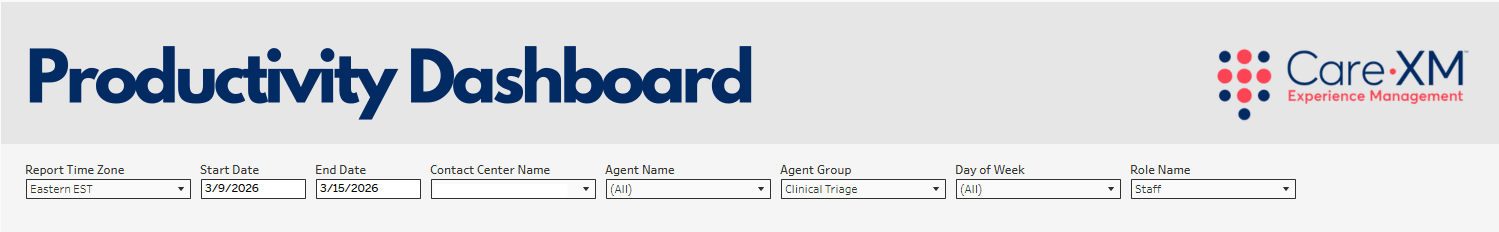
- Report Time Zone - The report will process the data in the Eastern Time Zone, to switch time zones, click on the drop down and choose the correct option.
- Date Range - The default date range will display the last week. To look up a specific date range, manually enter the date.
- Contact Center Name - This filter allows the user to select the call center(s) for which they want to see data. Only center(s) that the user has access to AND that have data in the selected time frame will be shown in the filter options.
- Agent Name - his filter allows users to filter to select the Agent(s) they want to see in the dashboard. Due to the volume of data available, this defaults to no Agents selected. It is recommended that only a few users are selected at a time to keep the dashboard loading time down.
- Agent Group - This filter allows users to filter call reports down to call volume handled by different groups of agents within the call center. (Enterprise clients only)
- Day of Week - This filter defaults to All. It allows users to view specific days of the week and get to week day/weekend.
- Role Name - Type of profile role users have. For example, Administrator, Global Administrator, Manager, and/or Staff.
Note: For report to filter correctly, click on the "Apply" button on the bottom of each filter's drop down. Only applies if the list exceeds 10 options.
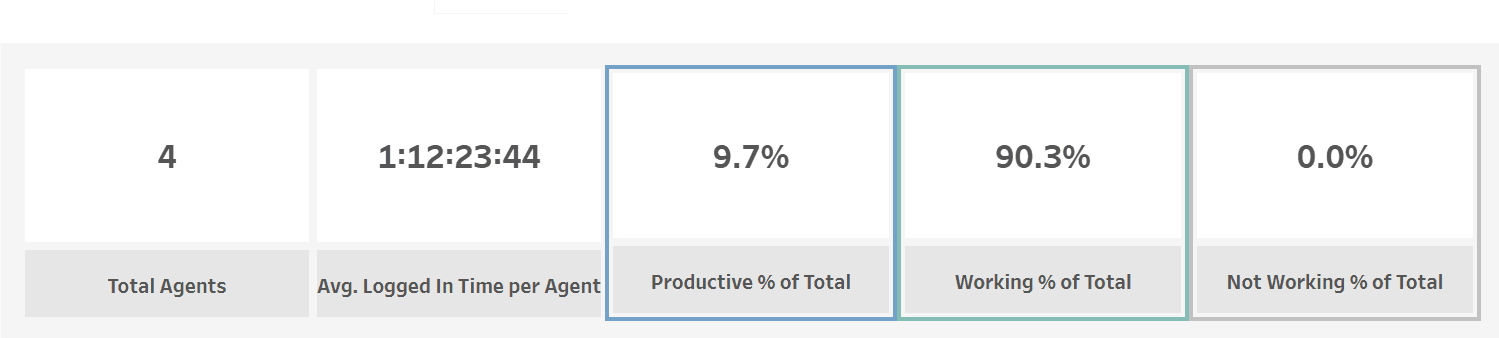
The first part of the dashboard has five tiles demonstrating the count of Total Agents, Average Logged In Time per Agent, Productive Percentage of Total Logged In Time, Working Percentage of Total Logged In Time, and Not Working Percentage of Total Logged In Time. Hover over any titles for more insight on the data.
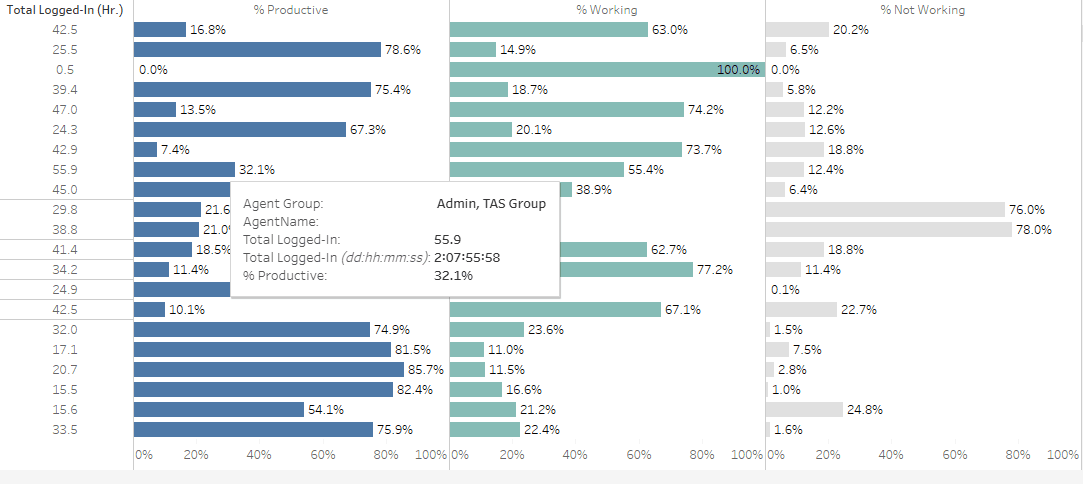
The Productivity by Agent shows what percentage of each agent's logged-in time spent being Productive, Working, and Not Working. Each category has its own color making it easy to distinguish and comparable. The bar graphs also display their percentages. The data will, by default, display the Agent's Name and their productivity. Note: Clicking on an Agent's name will update all other tiles on the dashboard to reflect data only for that agent.
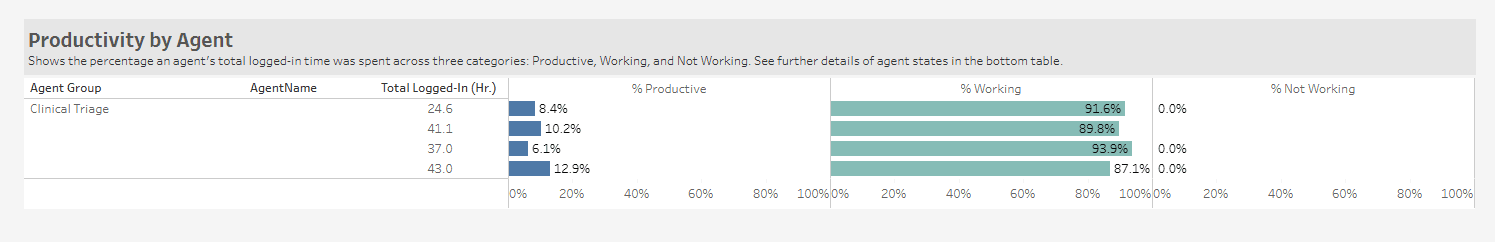
Hovering over will display their total logged in time, total logged-in duration in Day(s):Hour(s):Minute(s):Second(s), and their percentage of being productive, working, and not working.
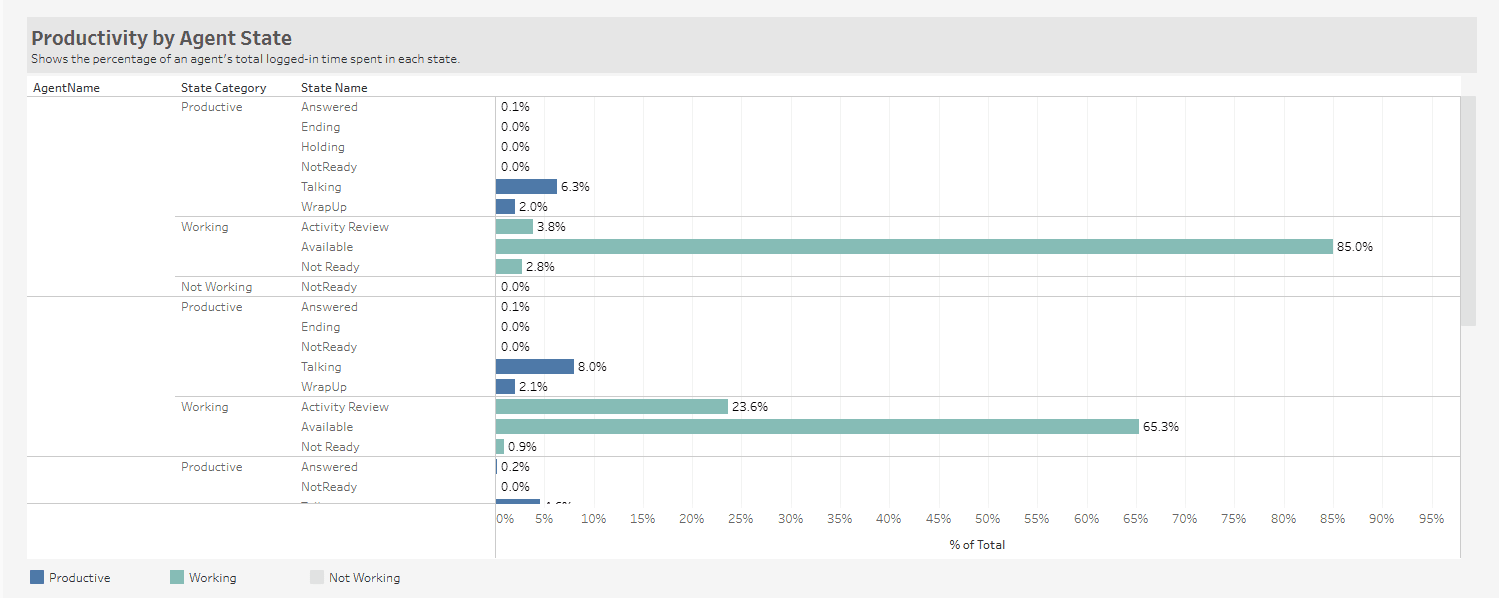
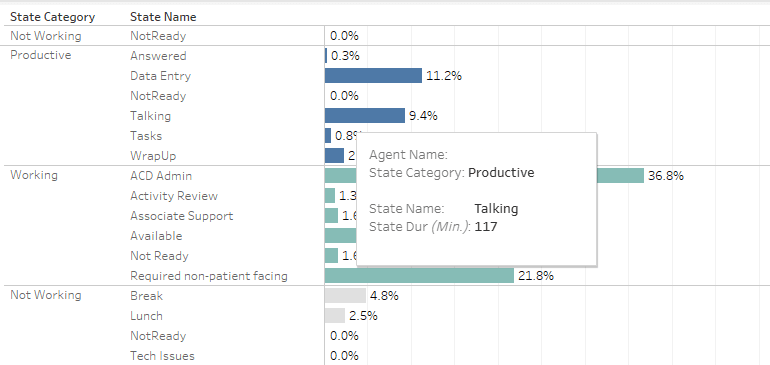
The Productivity by Agent State shows a detailed view of percentages based on time spent in different states (status). You will have a bar graph with the time listed in percentages. By default, the data will display all of the agents that were selected on the filters. To filter down by State Category, you can click on the minus (-) sign next to that column title.
Hovering over will display the actual time spent in each state (in minutes) along with the state category and name.
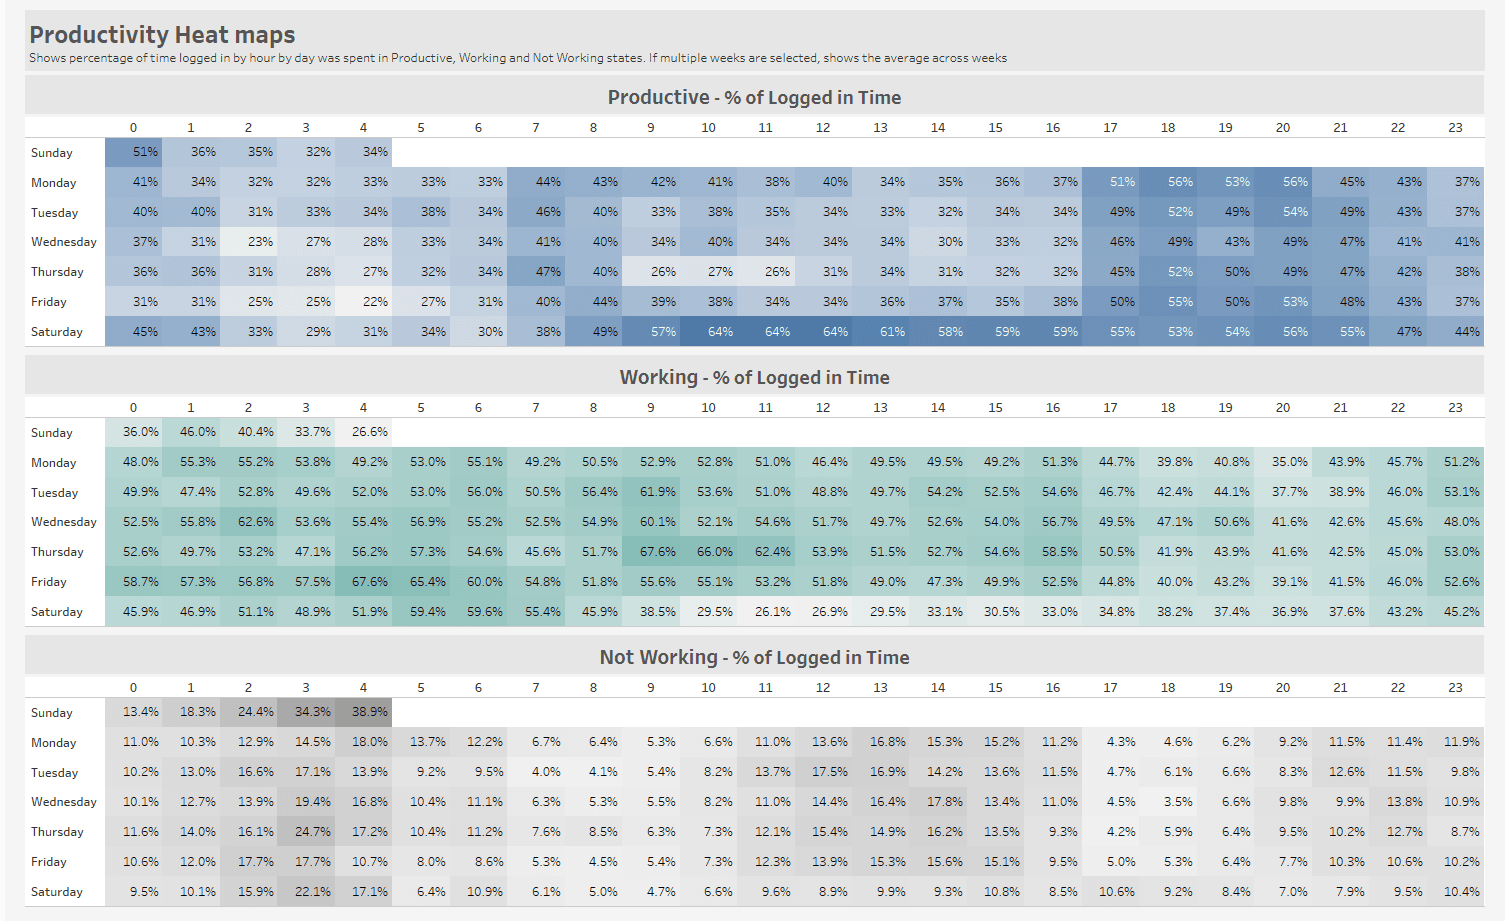
The Heat Maps show the hourly percentage of time spent in each group of states. This allows users to see at a glance what day and hour their agents are experiencing higher or lower productivity.
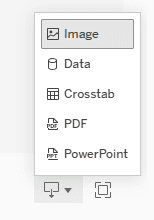
To download, click on "Download", then select your file format: