Activities by Hour Heat Map
To access Insights, go to https://insights.carexm.com
You will use the same login information that you use to access CXM to log into Insights. This means that if you change your CXM password, it will update in Insights as well.
Your CXM user must have the Analytics toggle turned ON in order to log into Insights.
Once logged in, you will be on the landing page and can choose from the different reports by hovering over the category in the left side bar:
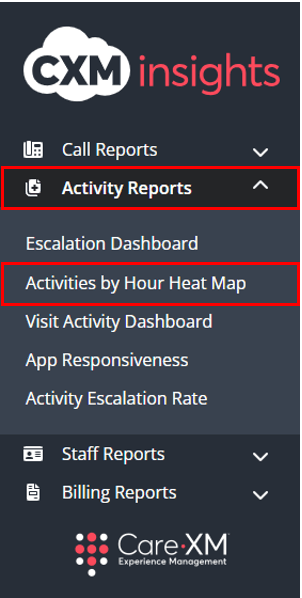
Choose "Activity Reports", then "Activities by Hour Heat Map".
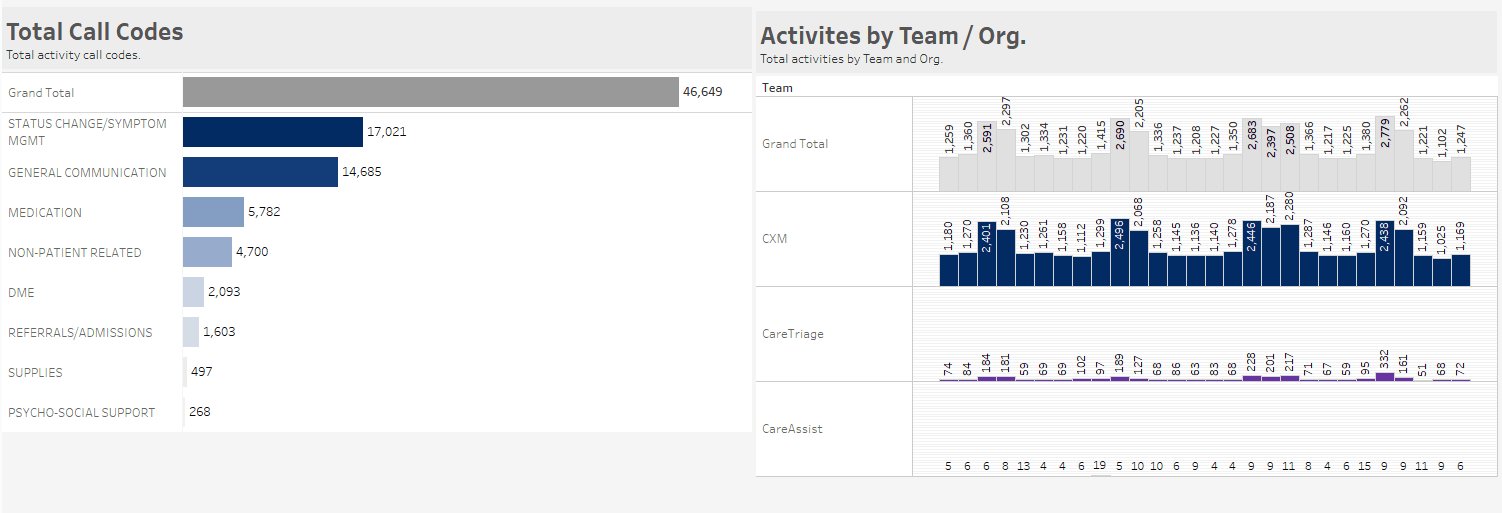
The Activities by Hour Heat Map shows a count of activities in a by-hour by-day format to allow users to see the hourly distribution of activities being created and a count of activities by call code to provide a quick view into how many activities were created for each call code and category across the time period selected. In the middle there are two tiles, one with the Total Call Codes and the other with the Activities by Team/Organization. On the bottom of the report, the Activity Details will be displayed.
Users can click on a Call Code, Call Code Category, or any data from the Activities by Team/Organization to see the heat map update to reflect the arrival pattern for those activities. Click within the heat map to see the Total Call Codes, Activities by Team/Organization tiles, and Activity Details update with the count for each call code.
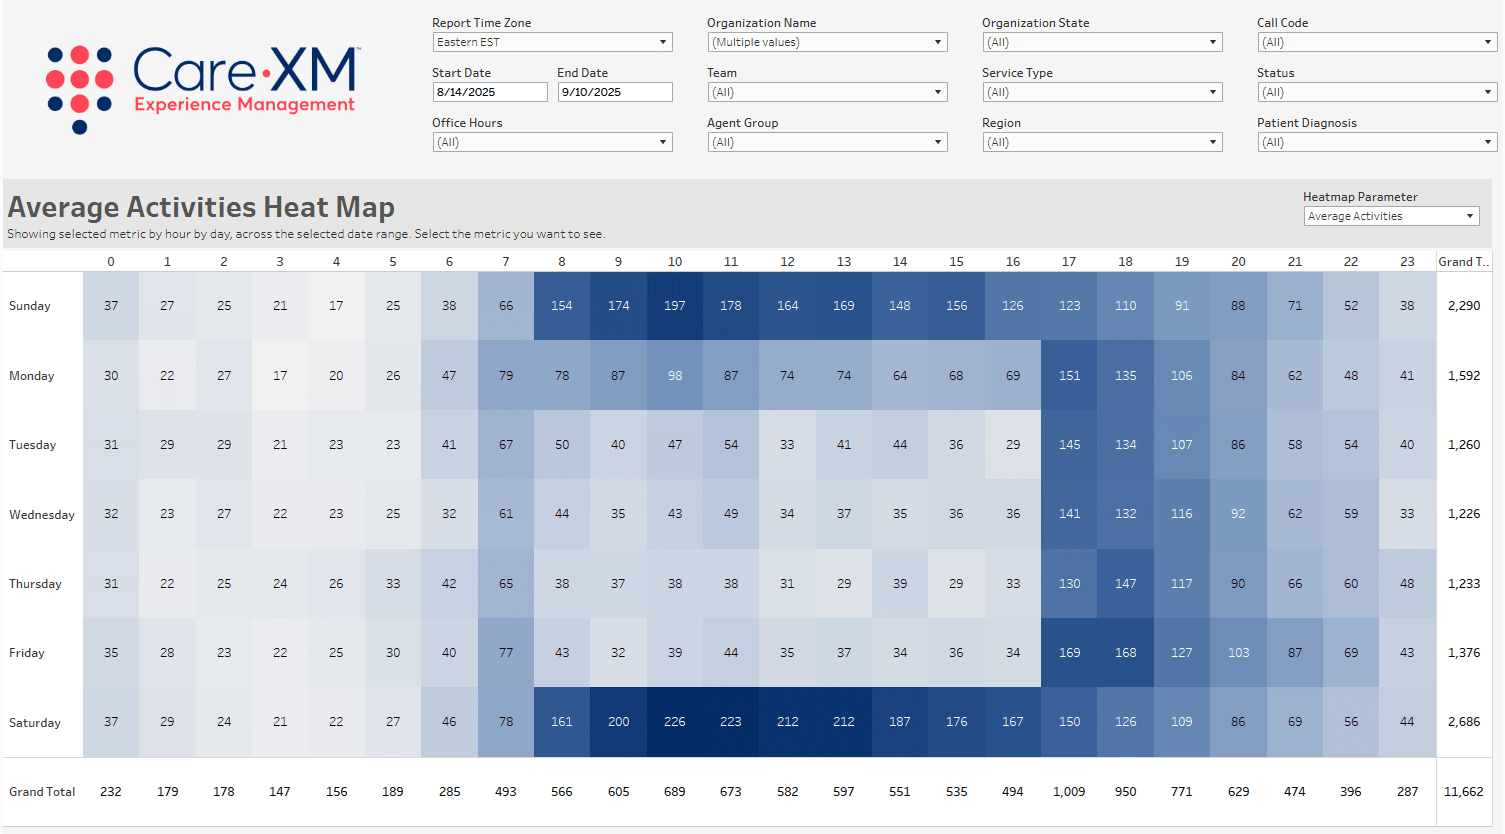
This report can be filtered by Report Time Zone, Organization Name, Organization State, Call Code, Date Range, Team, Service Type, Status, Office Hours, Agent Group, Region, and Patient Diagnosis.
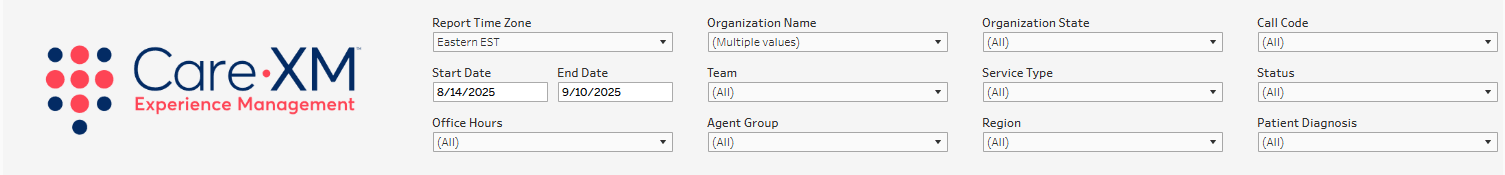
- Report Time Zone: The report will process the data in the user's time zone, to switch time zones, click on the drop down and choose the correct option.
- Organization Name: This filter allows the user to select the organization(s) for which they want to see data. Only Organization(s) that the user has access to AND that have data in the selected time frame will be shown in the filter options.
- Organization State: This filter allows users to filter the list of Organizations down to those located in the selected geographical state(s). By default, all Organization States will be selected.
- Call Code: Primary reason for call.
- Date Range: The default date range chooses today minus 30 days. To look up a specific date range, manually enter the date.
- Team: This filter allows the user to see only what was created by a specific team. For example, if filtered down to CareTriage, the report would only show data for calls handled by CareTriage.
- By default, this filter will include all Teams selected. The available options shown will be only those relevant to the Organization(s) selected.
- CareAssist - The CXM Non-Clinical Team
- CareTriage - The CXM Clinical Team
- CXM - The client's Enterprise Team
- Service Type: This filter allows the user to select the service type the patient is receiving. For example, Home Health Care, Hospice Care, etc..
- Status: This filter allows the user to select the final status of the call. For example, Active, Completed, Pending, etc..
- Office Hours: This filter allows users to filter the data to show Calls or Activities that occurred only during Office Hours or After Hours.
- Agent Group: This filter allows users to filter call reports down to call volume handled by different groups of agents within the call center. (Enterprise clients only)
- Region: This filter allows users to filter large organizations by the Regions set on the Organization page, and quickly filters to a group of Organizations in a specific geographical area.
- Patient Diagnosis: This filter allows the user to select the patient's diagnosis.
Note: For report to filter correctly, click on the "Apply" button on the bottom of each filter's drop down. Only applies if the list exceeds 10 options.
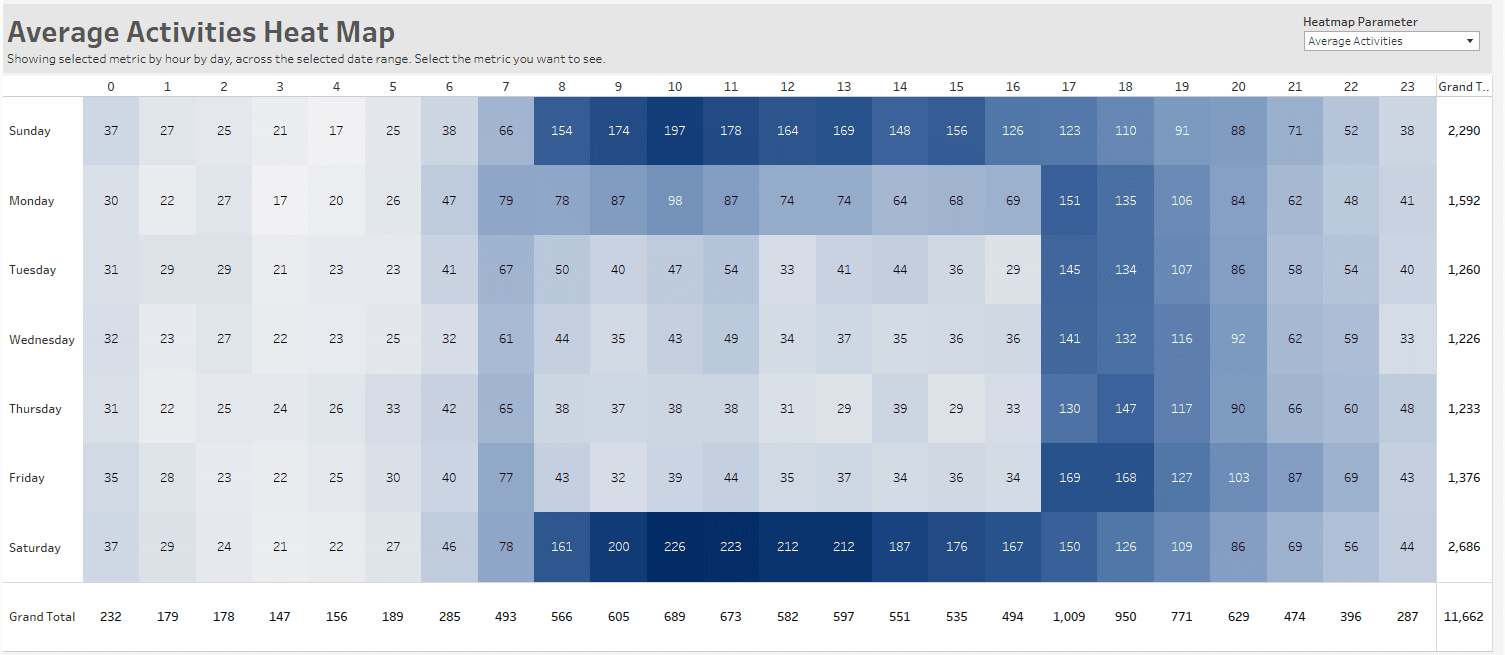
The Heat Map has a parameter on the top-right corner that can be switched between Total Activities and Average Activities. Total Activities will have the heat map reflect the total activities created for the timeframe selected by hour by day. The Average Activities will have the heat map reflect the average count of activities created by hour by day for the timeframe selected. The last column on the left and the last row on the bottom show a grand total of activities.
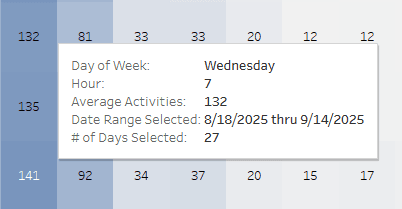
The on-hover will show you specific information for the tile(s) selected.
The Total Call Code box shows the total activity call codes for the timeframe selected.
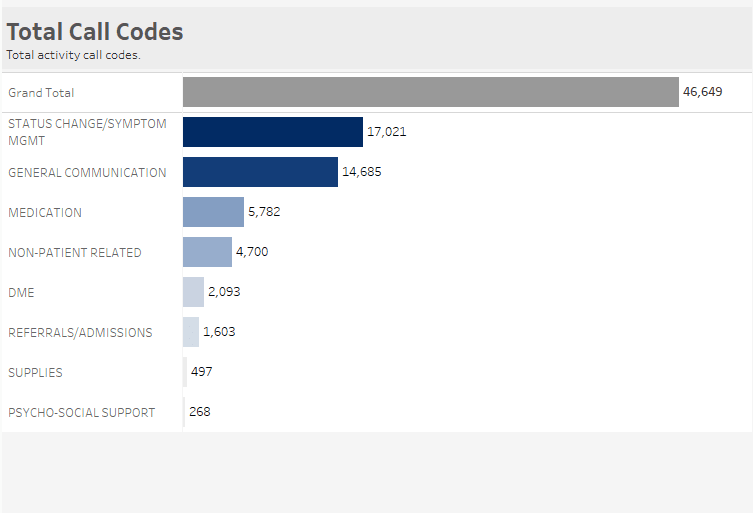
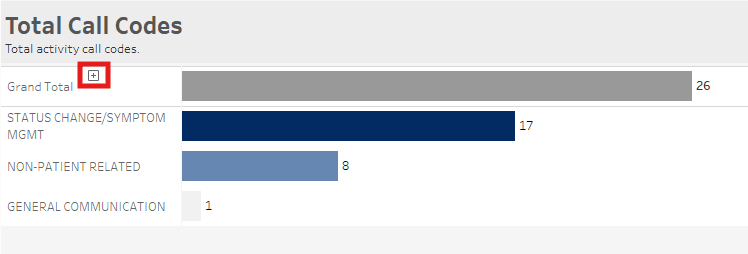
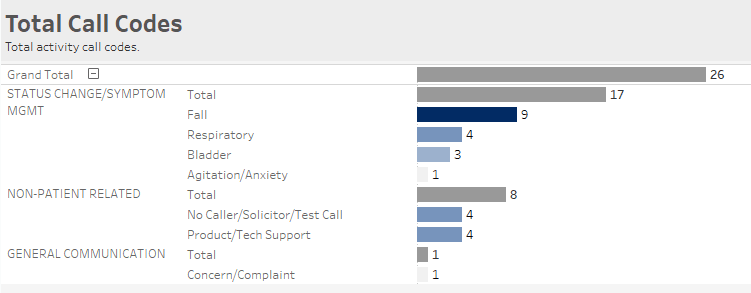
Underneath the total, the count is broken down by general call code. For a more specific call code activity count, hover over the "Grand Total" and click on the plus (+) sign to expand.
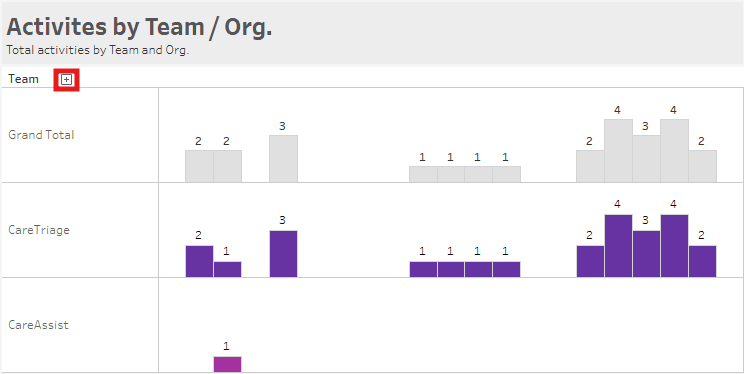
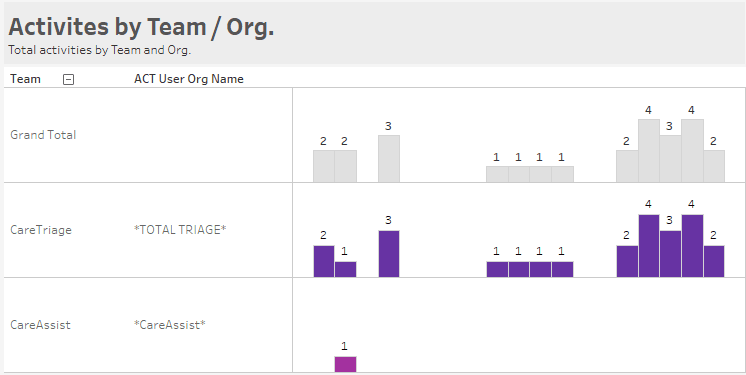
The Activities by Team/Organization tile will show a count of activities created by each team.
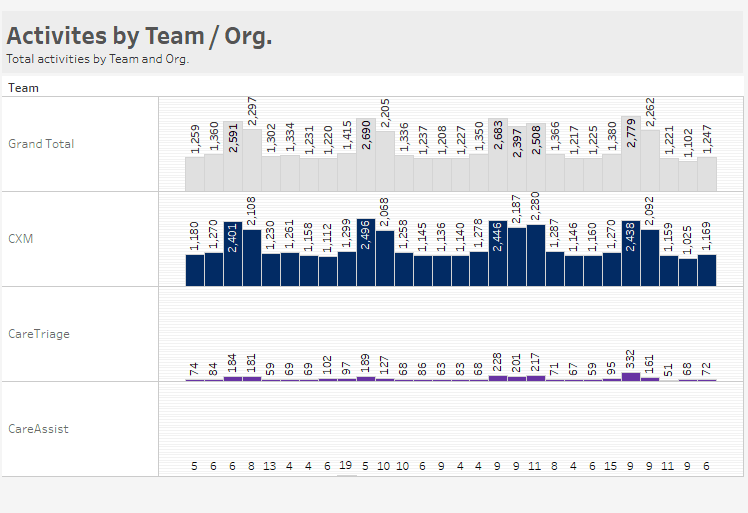
Hover over the "Grand Total" and expand it by clicking on the plus (+) sign to show the count of activities created by users from each primary organization.
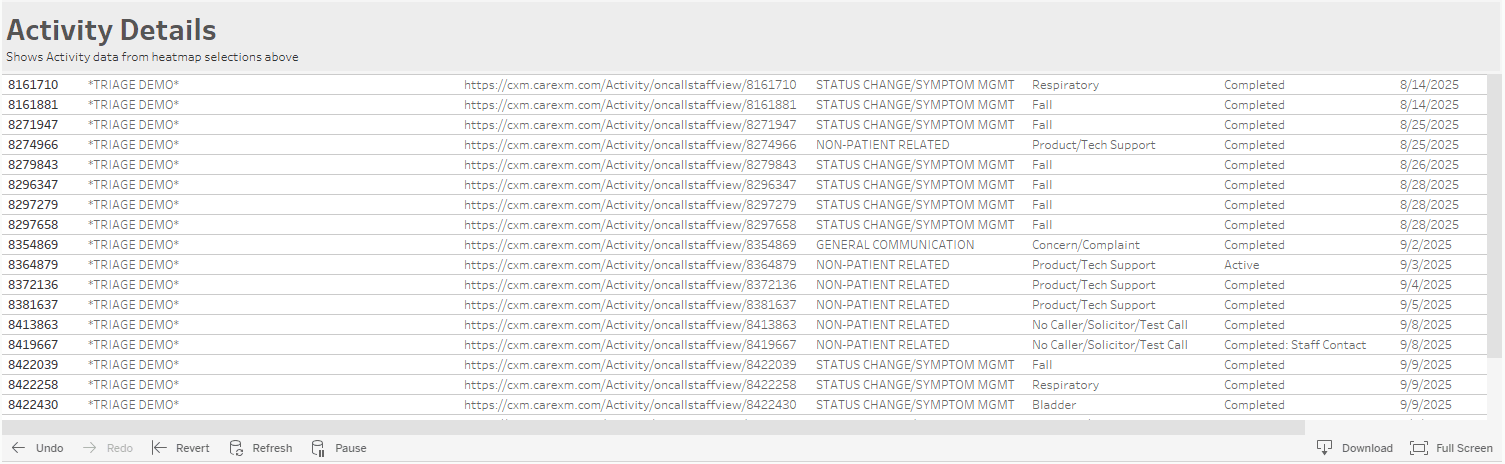
The Activity Details has one row for each Activity in the cell(s) selected.
Once a row from Activity Details is clicked on, an on-hover will appear with a link that will navigate directly to the Activity on CXM. Below is a step-by-step guide:
1. Click on the URL for the activity desired.
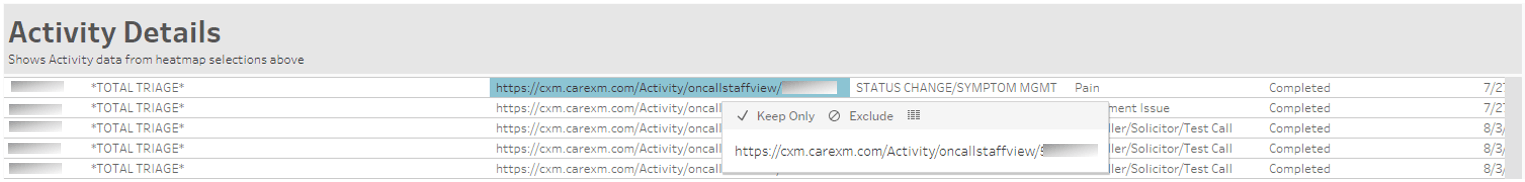
2. Highlight the link from the pop-up, right click, and click on the "Go to" link.
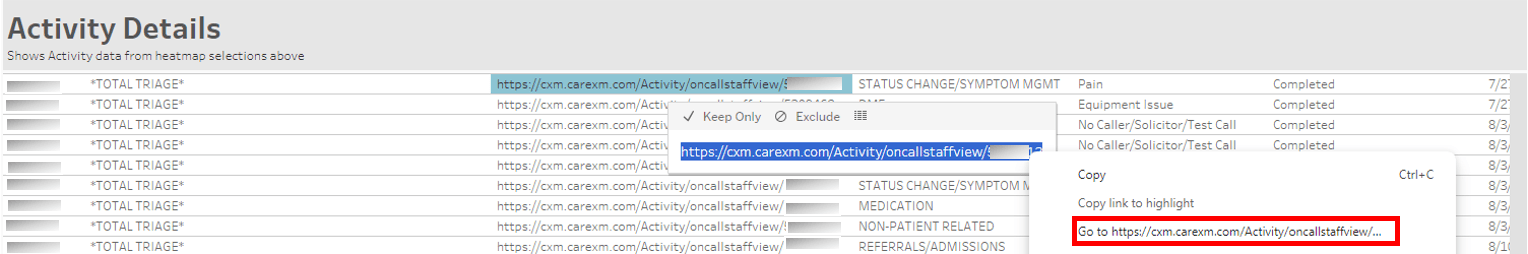
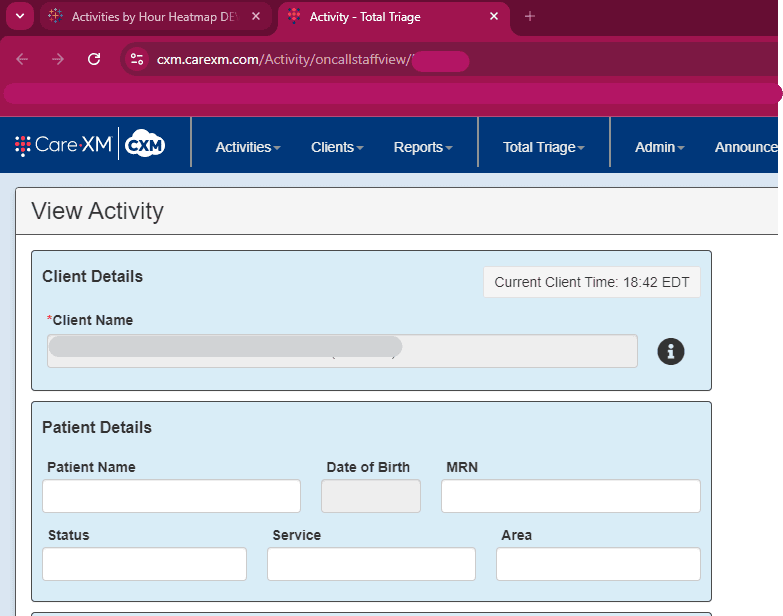
3. The Activity page for that will auto-populate in another tab. If you're not already logged into CXM, it will prompt you to before opening the Activity page.
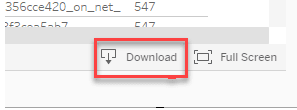
The report can be downloaded, select "Download" in the lower right hand corner of the report:
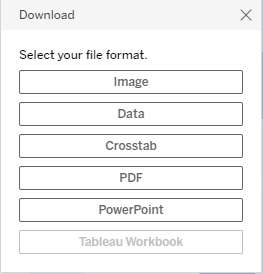
Choose your file format:
For more details on how to download/pivot data click here.