Call Volume by Hour Heat Map
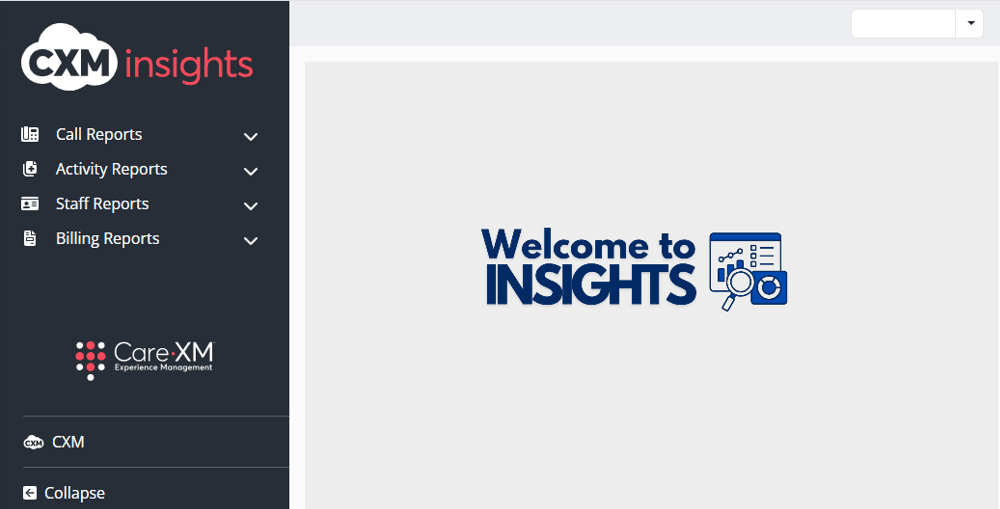
To access Insights, go to https://insights.carexm.com
You will use the same login information that you use to access CXM to log into Insights. This means that if you change your CXM password, it will update in Insights as well.
Your CXM user must have the Analytics toggle turned ON in order to log into Insights.
Once logged in, you will be on the landing page and can choose from the different reports by hovering over the category in the left side bar:
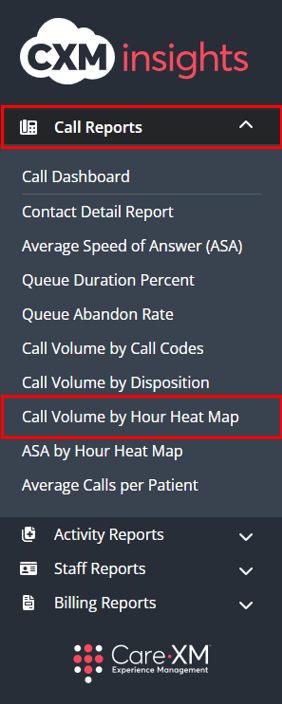
Choose "Call Reports" and then "Call Volume by Heat Map"
This report displays the organizations call volume per hour for a specific time frame in a "Heat Map" style.
This report can be filtered by Report Time Zone, Organization Name, Call Direction, Call Code, Date Range, Team, Disposition, Staff Name, Agent Group, Organization State, Region, and Office Hours.
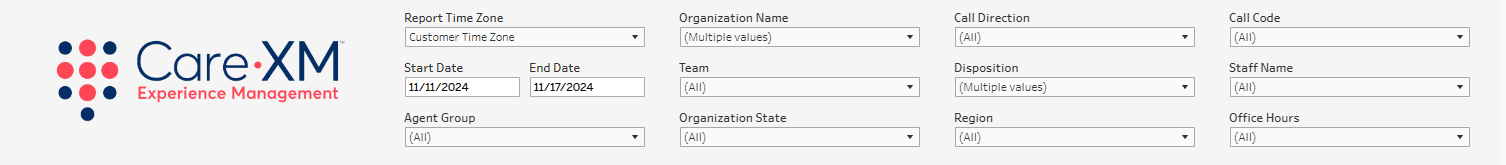
- Report Time Zone - Defaults to time zone of the organization selected. Allows user to choose time zone to view data.
- Organization Name - Choose organization(s) to view in the dashboard. Defaults to all, user will only see organizations they have access to.
- Call Direction - This filter allows the user to select between inbound, outbound, or all calls.
- Call Code - This filter allows the user to select from a list of call codes.
- Date Range - The default start and end dates display the previous week. Change the dates to display a specific time period.
- Team - This filter allows the user to see only what was created by a specific team. For example, if filtered down to CareTriage, the report would only show data for calls handled by CareTriage.
- CareAssist - Calls taken by CareXM Non-Clinical team (Patient Care Advocates).
- CareTriage - Calls taken by CareXM Clinical team (Registered Nurses).
- CXM App - Calls taken in the Legacy CXM App (Total Triage).
- CXM - Calls taken by Enterprise client users.
- Note: User will only see Teams used by organizations they have access to. Each team has their own color representing their data.
- Disposition - The report can filter by disposition, which displays what happened with the call.
- Staff Name - Name of staff member that took the call.
- Agent Group - This filter allows users to filter call reports down to call volume handled by different groups of agents within the call center. (Enterprise clients only)
- Organization State - This filter allows users to filter the list of Organizations down to those located in the selected geographical state(s). By default, all Organization States will be selected.
- Region - This filter allows users to filter large organizations by the Regions set on the Organization page, and quickly filters to a group of Organizations in a specific geographical area.
- Office Hours - This filter allows users to filter the data to show Calls or Activities that occurred only during Office Hours or After Hours.
Note: For report to filter correctly, click on the "Apply" button on the bottom of each filter's drop down. Only applies if the list exceeds 10 options.
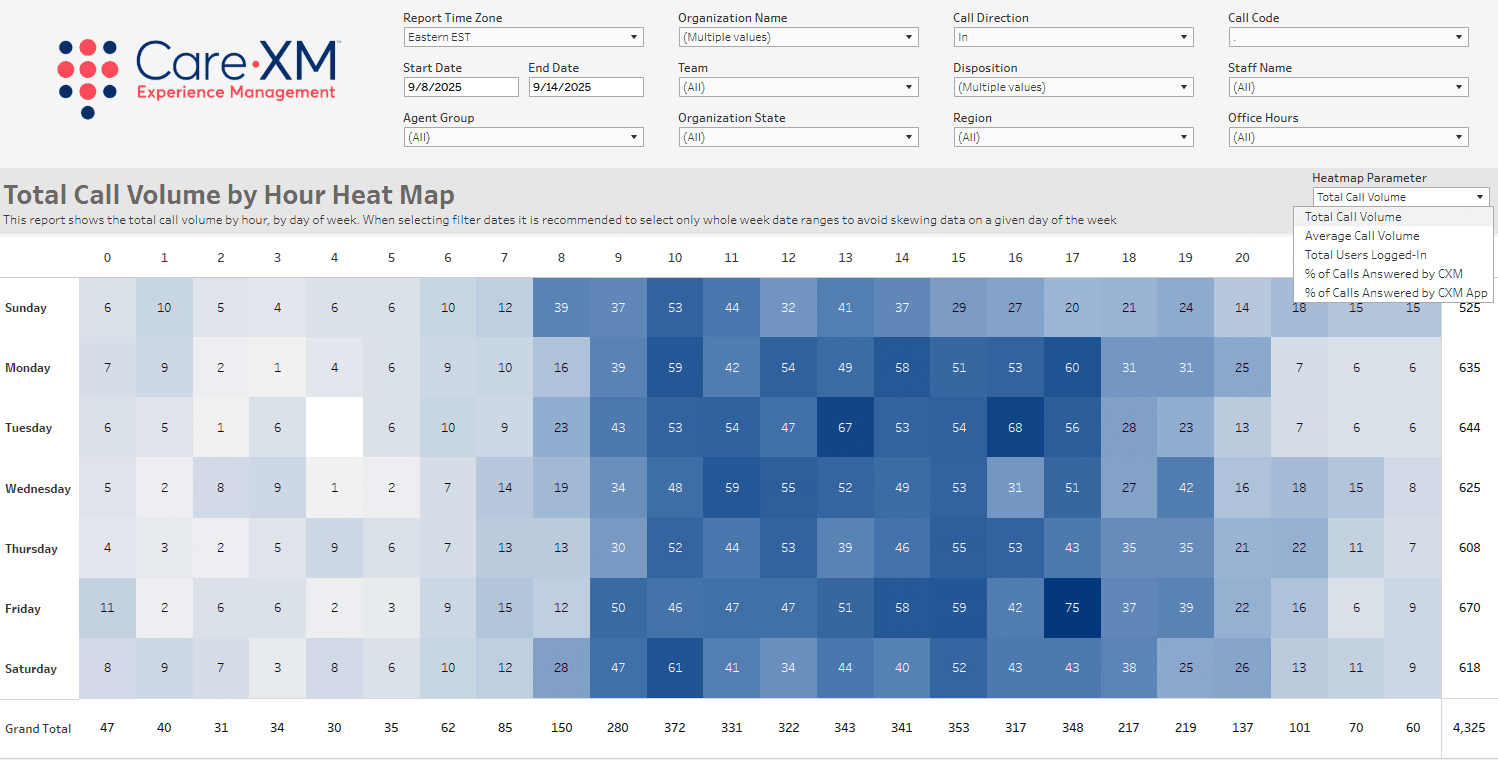
Using the Heat Map Parameter on the top right corner of the report, you can select for the Heat Map to show either Total Call Volume, Average Call Volume, Total Users Logged-In, Percentage of Calls Answered by CXM, and Percentage of Calls Answered by CXM App.
Total Users Logged-In parameter will help with visualizing how many users are actually handling calls. When used in tandem with the Logged in Staff Heat map, users can see the difference between the number of users logged in and the number of users who handled calls across the same time period.
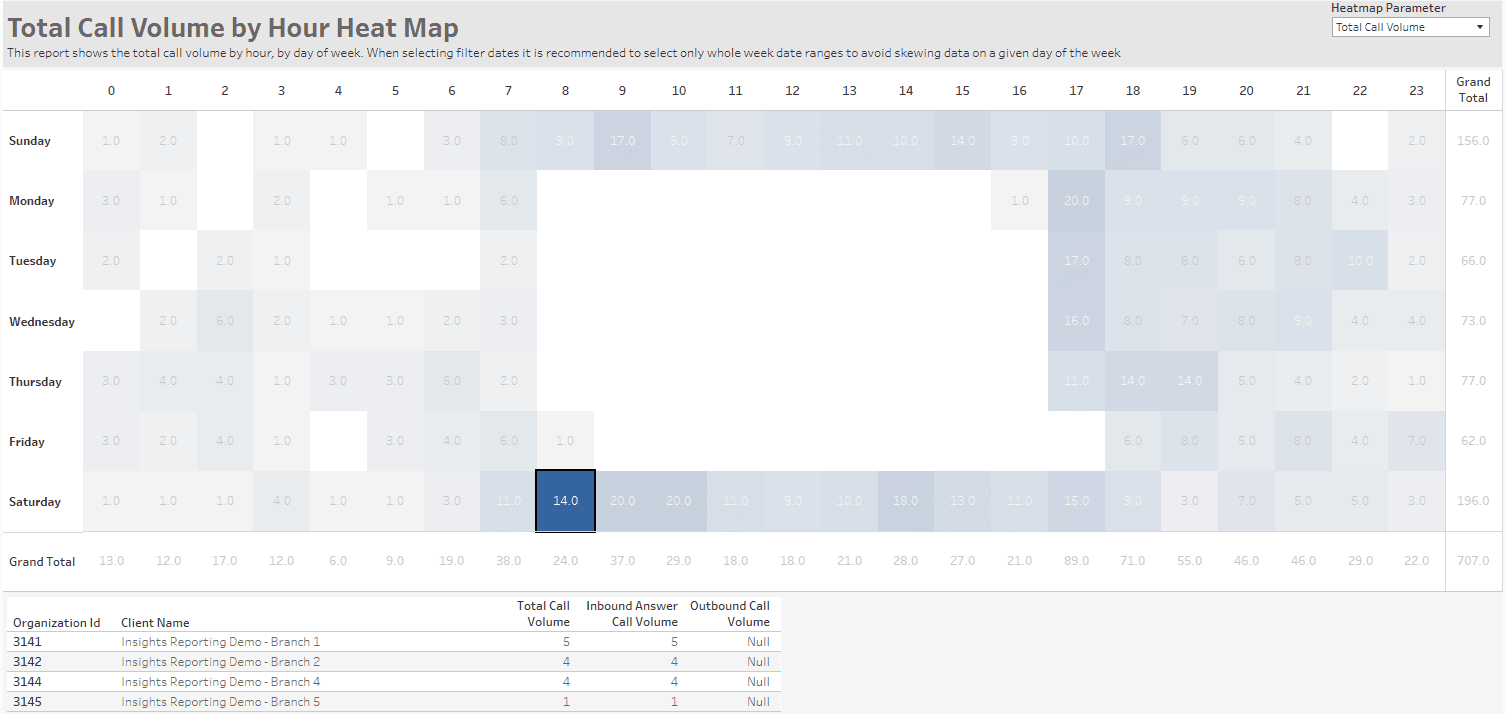
When a tile is selected on the heat map, a summary table appears underneath the heat map. The summary table will show one row per Organization with the columns of Total Call Volume, Inbound Answer Call Volume, and Outbound Call Volume.
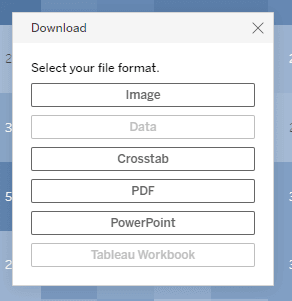
The report can be downloaded by file type: